Observability
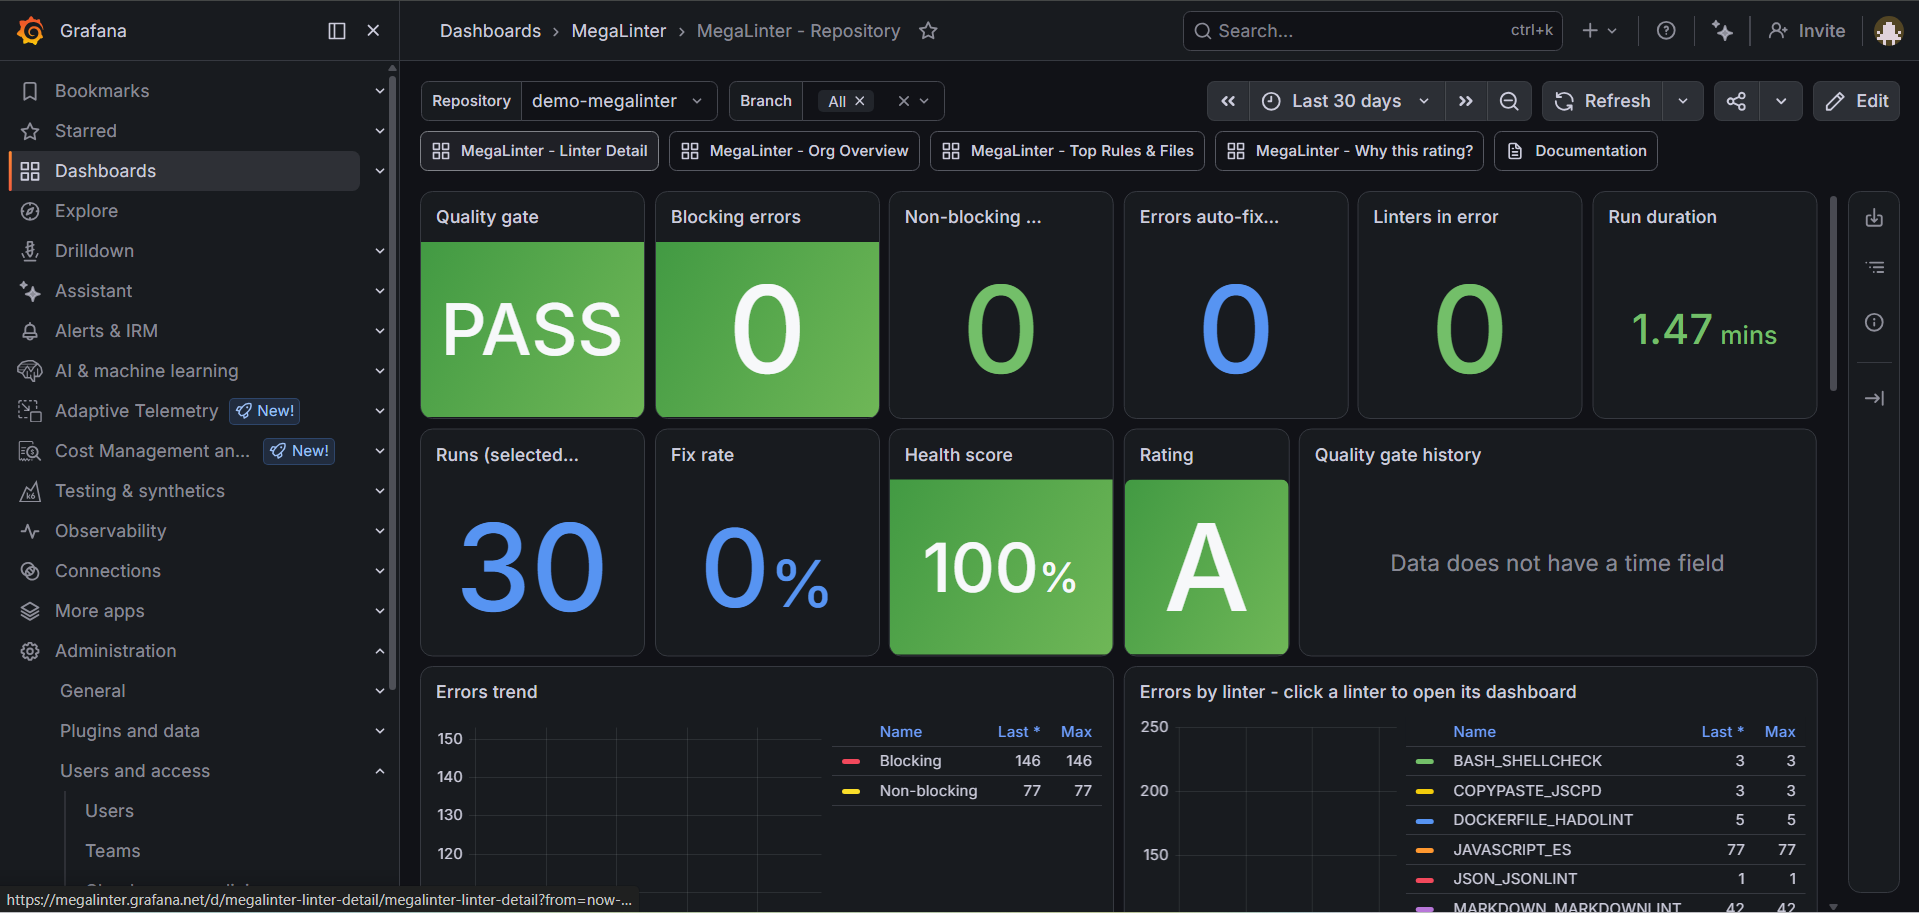
MegaLinter can send the results of every run to your observability platform, so you can follow your code quality over time with ready-to-use dashboards: quality gate status, errors trends, slowest linters, most violated rules and most impacted files, across all your repositories.
Supported providers:
| Provider | Metrics | Logs / detailed records | Dashboards provisioning |
|---|---|---|---|
| Grafana | Prometheus (Grafana Cloud or self-hosted Mimir) | Loki | --upload-dashboards grafana |
| Datadog | Datadog metrics | Datadog logs | --upload-dashboards datadog |
| Elastic | Elasticsearch indexes | Elasticsearch indexes | --upload-dashboards elastic |
| New Relic | New Relic Metric API | New Relic Log API | --upload-dashboards newrelic |
How it works
At the end of each run, the API Reporter builds a payload (version 2) containing:
- Run-level KPIs: quality gate status (pass/fail), repository health score, blocking and non-blocking error counts, number of auto-fixed errors, number of linters in success/warning/error, number of analyzed files, run duration
- One record per linter: errors found, files analyzed, elapsed time, blocking status, human-readable output
- Top rules and top files (up to 20 each, per linter), parsed from the linters SARIF output
The payload is then sent to each provider declared in API_REPORTER_PROVIDER (comma-separated list, so you can send to several providers at once).
Quick start
-
Enable the reporter in
.mega-linter.yml:API_REPORTER: true API_REPORTER_PROVIDER: grafana # or datadog, elastic, newrelic, or a comma-separated list -
Define the provider authentication variables as CI/CD secrets (see the provider page for the exact list).
-
Provision the dashboards in your provider (also proposed during
npx mega-linter-runner --installand--upgrade):npx mega-linter-runner --upload-dashboards grafana
The dashboard definitions are versioned in docs/dashboards of the MegaLinter repository, with a manifest describing the metrics contract. Uploads are idempotent: running the command again updates the existing dashboards in place.
Repository health score
Each run produces a health score between 0 and 100 for the repository: linters in success count fully, linters with non-blocking errors count half, linters with blocking errors count zero (100 * (lintersSuccess + 0.5 * lintersWarning) / lintersCount). The dashboards show the latest score per repository, an A-E rating derived from it (A >= 90, B >= 80, C >= 65, D >= 50, E < 50), its evolution over time, and an estimate of the reviewer time saved by MegaLinter auto-fixes (5 minutes per fixed error). Every rating tile leads to a "Why this rating?" view explaining the formula, the linters status breakdown, and which linters drag the score down (dedicated dashboard on Grafana, dedicated page on New Relic, dedicated section on Datadog and Elastic).
Dashboards navigation
Dashboards are designed for fleet-to-detail navigation: the overview shows all repositories (health score, quality gate, errors), and each repository entry links or filters down to the repository detail (health evolution, errors by linter and by language, slowest linters), down to the linter detail (rules, files, outputs):
- Grafana: click a repository in the overview table/charts to open the Repository dashboard; click a linter to open the Linter Detail dashboard
- Datadog: use the
git_repo_nametemplate variable, or the Focus on this repository link on repository charts - New Relic: click a repository facet to open the Repository detail page, or use the Repository variable
- Elastic: click any repository/linter bar to filter the whole dashboard (native Kibana filtering)
All dashboards can also be filtered by branch (Grafana/New Relic branch variable, Datadog git_branch_name template variable, Kibana filter bar), e.g. to follow the stats of your default branch only.
Configuration variables
General variables (see each provider page for the provider-specific ones):
| Variable | Description | Default |
|---|---|---|
API_REPORTER |
Activates the API reporter | false |
API_REPORTER_PROVIDER |
Comma-separated list of target providers (grafana, datadog, elastic, newrelic) |
grafana |
API_REPORTER_DETAILS |
Include per-rule and per-file breakdowns (parsed from SARIF output) in the payload | true |
API_REPORTER_ORG_IDENTIFIER |
Organization identifier added to all records (useful to group repositories) | |
API_REPORTER_DEBUG |
Log the payloads sent to the providers | false |
Metrics reference
Metric names by provider (same fields everywhere, different naming conventions):
| KPI | Grafana (Prometheus) | Datadog / New Relic |
|---|---|---|
| Quality gate (1=pass) | megalinter_run_qualityGate |
megalinter.run.qualityGate |
| Health score (0-100) | megalinter_run_healthScore |
megalinter.run.healthScore |
| Blocking errors | megalinter_run_blockingErrors |
megalinter.run.blockingErrors |
| Non-blocking errors | megalinter_run_nonBlockingErrors |
megalinter.run.nonBlockingErrors |
| Errors auto-fixed | megalinter_run_totalErrorsFixed |
megalinter.run.totalErrorsFixed |
| Run duration (s) | megalinter_run_runDurationS |
megalinter.run.runDurationS |
| Errors per linter | megalinter_linter_run_numberErrorsFound |
megalinter.linter.numberErrorsFound |
| Linter duration (s) | megalinter_linter_run_elapsedTime |
megalinter.linter.elapsedTime |
All metrics carry the source, orgIdentifier, gitIdentifier, gitRepoName and gitBranchName dimensions, plus descriptor, linter and linterKey on linter-level metrics, and megalinterVersion / megalinterFlavor on run-level metrics (snake_case tag keys on Datadog).
Detailed records (linter outputs, top rules, top files) are sent as logs/documents with a recordType dimension (run, linter, rule, file).