Grafana integration
Send MegaLinter results to Grafana Loki (logs) and Prometheus (metrics), and provision the MegaLinter dashboards in your Grafana instance. Works with Grafana Cloud (free tier is enough to get started) and self-hosted Grafana + Loki + Mimir/Prometheus.
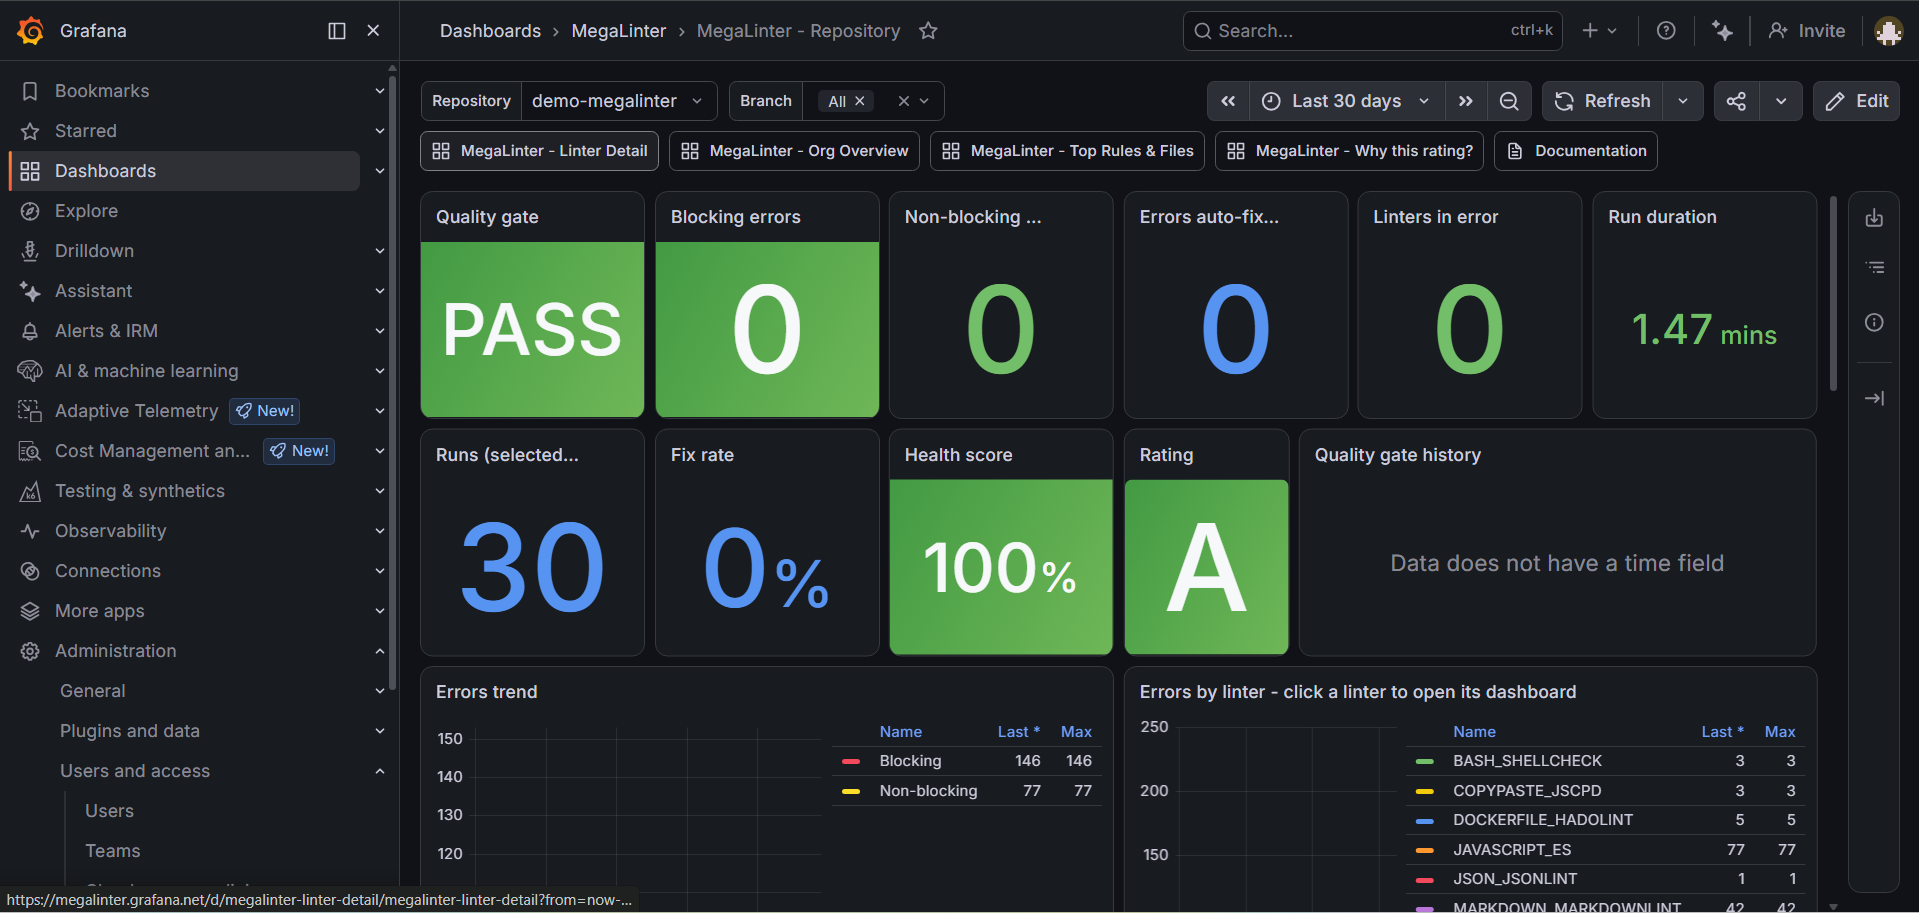
Dashboards
| Dashboard | Content |
|---|---|
| MegaLinter - 1. Org Overview | Portfolio view: quality gate pass rate, blocking errors and trends across all repositories |
| MegaLinter - 2. Repository | Quality gate, KPIs, errors and duration trends, linters table and outputs for one repository |
| MegaLinter - 3. Linter Detail | Drill-down on one linter: errors, duration, top rules, top files, raw output |
| MegaLinter - 4. Top Rules & Files | Most violated rules and most impacted files across repositories |
| MegaLinter - 5. Why this rating? | Explanation of the A-E rating: formula, linters success/warning/error counts, top offenders |
Provision them with:
GRAFANA_URL=https://yourstack.grafana.net GRAFANA_TOKEN=glsa_xxx \
  npx mega-linter-runner --upload-dashboards grafana
| Variable | Description |
|---|---|
GRAFANA_URL |
Base URL of your Grafana instance (e.g. https://yourstack.grafana.net) |
GRAFANA_TOKEN |
Service account token with dashboards write permission |
The dashboards are created in a MegaLinter folder and updated in place on subsequent uploads. Each dashboard has datasource pickers, so you can select your Loki and Prometheus datasources on first display.
The dashboards are linked together: click a repository in the Org Overview table or charts to open its Repository dashboard, and click a linter in the Repository dashboard to open its Linter Detail dashboard.
Sending data
Add to your MegaLinter configuration (URLs in .mega-linter.yml, secrets as CI/CD environment variables):
API_REPORTER: true
API_REPORTER_PROVIDER: grafana
API_REPORTER_URL: https://logs-prod-xxx.grafana.net/loki/api/v1/push
API_REPORTER_METRICS_URL: https://influx-prod-xx-prod-xx.grafana.net/api/v1/push/influx/write
| Variable | Description |
|---|---|
API_REPORTER_URL |
Loki push URL (ends with /loki/api/v1/push) |
API_REPORTER_BASIC_AUTH_USERNAME |
Loki instance id (Grafana Cloud) or basic auth username |
API_REPORTER_BASIC_AUTH_PASSWORD |
Access token with logs:write scope |
API_REPORTER_METRICS_URL |
Influx-format write URL (Grafana Cloud) or Prometheus remote-write compatible URL |
API_REPORTER_METRICS_BASIC_AUTH_USERNAME |
Prometheus instance id (Grafana Cloud) or basic auth username |
API_REPORTER_METRICS_BASIC_AUTH_PASSWORD |
Access token with metrics:write scope |
API_REPORTER_BEARER_TOKEN / API_REPORTER_METRICS_BEARER_TOKEN can be used instead of basic auth for self-hosted endpoints.
Grafana Cloud walkthrough
- Create a free account on grafana.com and open your stack
- Loki push URL: in your stack, open the Loki (Logs) details page: it shows the push URL (
https://logs-prod-xxx.grafana.net/loki/api/v1/push) and the instance id to use asAPI_REPORTER_BASIC_AUTH_USERNAME - Metrics write URL: open the Prometheus (Metrics) details page, and transform the displayed URL: replace
prometheus-byinflux-and the path by/api/v1/push/influx/write(e.g.https://influx-prod-24-prod-eu-west-2.grafana.net/api/v1/push/influx/write); the instance id isAPI_REPORTER_METRICS_BASIC_AUTH_USERNAME - Access token: create a Cloud Access Policy with
logs:writeandmetrics:writescopes, generate a token (glc_...) and use it asAPI_REPORTER_BASIC_AUTH_PASSWORDandAPI_REPORTER_METRICS_BASIC_AUTH_PASSWORD
Note: the Cloud Access Policy token (glc_..., for sending data) is not the same as the service account token (glsa_..., for uploading dashboards).
Data sent
- Prometheus metrics:
megalinter_run_*(run KPIs) andmegalinter_linter_run_*(per-linter), withsource,orgIdentifier,gitIdentifier,gitRepoName,gitBranchName(+descriptor,linter,linterKey) labels — see the metrics reference - Loki streams: one stream per record type (
recordTypelabel =run,linter,ruleorfile), carrying run KPIs, linter outputs, and per-rule / per-file occurrences